I started recording trip logs in 2019 at the start of the season. For every trip, I record a variety of data points such as where we went, what the weather was like, who went, which dog we used, how many birds we saw and how many we shot. I also record what clothes I wore so that I can easily figure out what to wear based on weather forecasts.
In mid-2019, I bought a GPS collar system after losing Willow in a cornfield. Not only does the system help me keep track of the dogs, it also allows me to record how far I walk and how far the dogs run. In addition, the handheld records tracks that I can superimpose on satellite maps (picture below) so I can see where we went. So, for years 2020 through present I have mileage data for me and the dogs.

In 2019, I was still working but only part-time at 24 hours per week. This gave me a lot of flexibility which allowed me to get out a lot. Bill and Kevin started hunting with me in mid-November of that year.
In 2020, I retired and COVID hit. The combination made it possible for me to get out a lot. It also made it impossible to ride share or share motel rooms. As a result, Bill and Kevin only hunted in Minnesota and all of my Iowa trips were solo.
In 2021, COVID was somewhat under control, we all got vaccinated and everyone joined me on a lot of trips, both in Minnesota and Iowa. Kevin and I both ended up with COVID that only shut us down for a week.
in 2022, our group was impacted my injuries. Bill missed almost the entire season with a knee injury. For me, my right hip was giving out and bothered me the entire season. Finally, a very difficult snow hunt in late December was too much for my hip and my season ended early.
In 2023, I replaced my hip in February and then walked all summer rehabbing it. I went into the season worrying whether my other hip would survive, which it mostly did. The replaced hip worked great, the questionable hip did not start to bother me until late in the season so I had a good year. Kevin was healthy and hunted with me all season. Bill was hunting Moose in Canada but still got out a few times.
Last year, I posted similar statistics after the season. So this post is all about the 2023 statistics.
As noted above, the GPS collar system allows me to track my mileage and the dogs mileage.
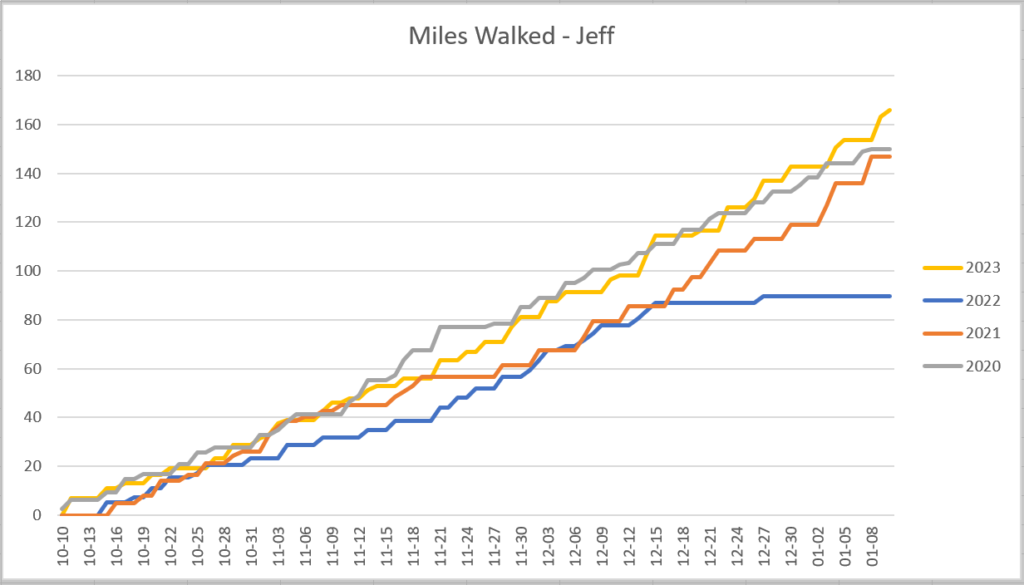
As you can see, 2023 was a good year for me. You can also see how my bad hip impacted 2022.

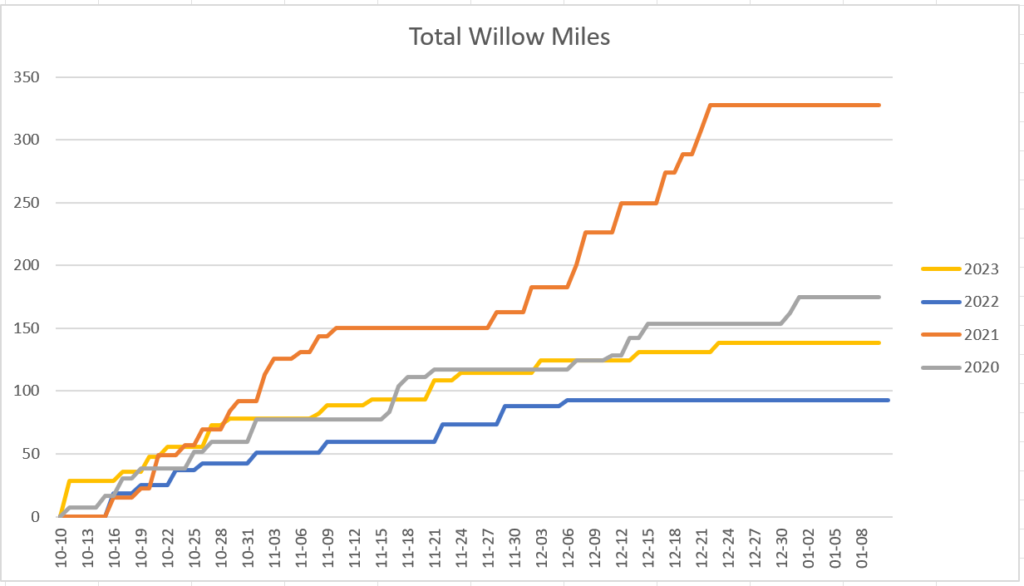
For the purpose of these graphs a “trip” is one day’s hunting. So, a two day trip to Iowa would be counted as 2 “trips”.
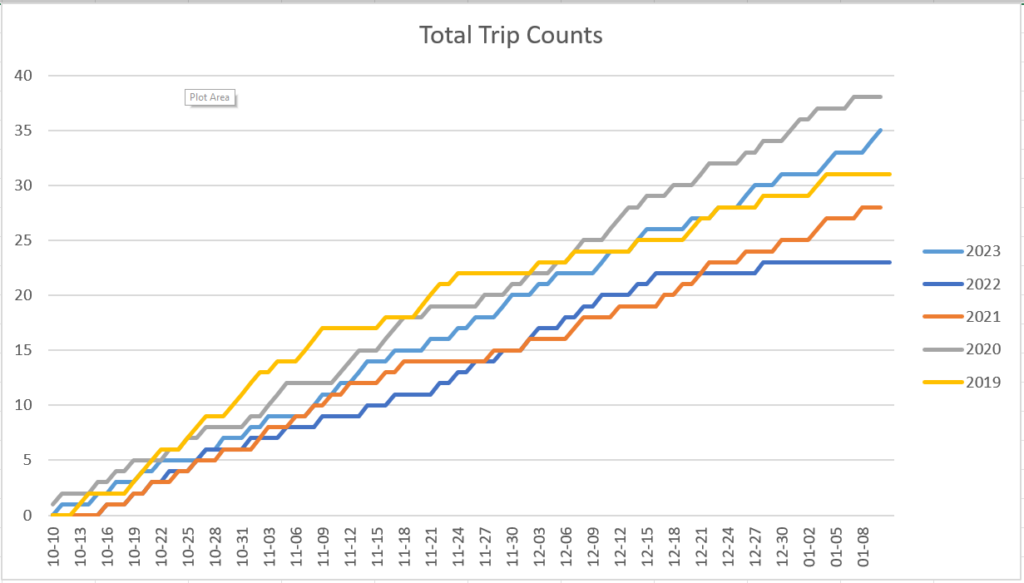
Our trip counts this year were second best, after the 2020 COVID/retirement year.

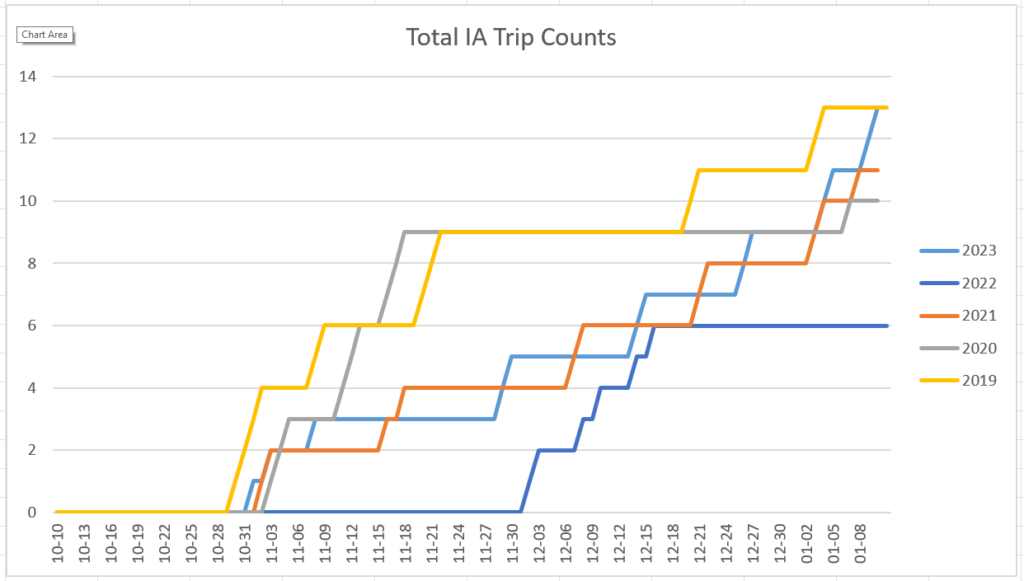
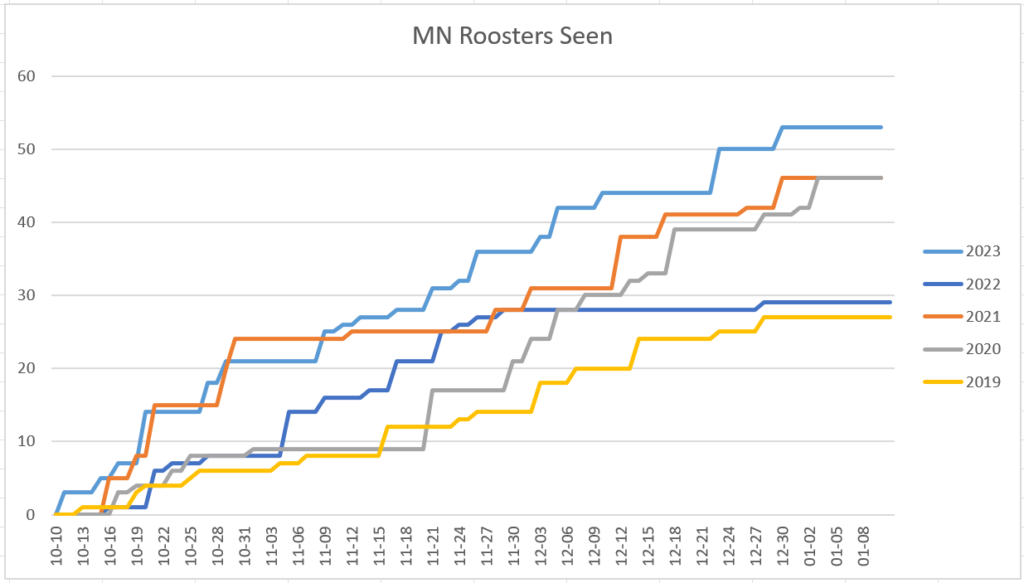
The bird counts, both roosters seen and roosters shot are a function of the number of trips and environmental conditions. 2021 and 2022 were drought years although nesting success was good. 2023 had a really good nesting season and drought conditions did not really impact the prairies until late in the season. 2022 had a ton of snow that impacted us a lot while 2023 was mild right up to the last week.
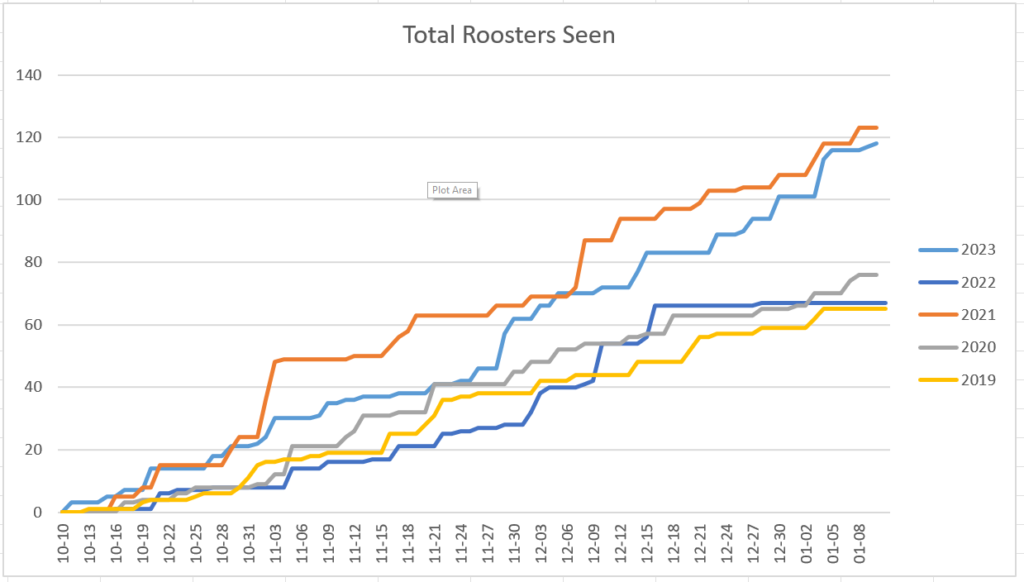
Overall, we saw more birds this year than any other. While our trip counts were up there, I think the good nesting season in spring of 2023 had the most impact.

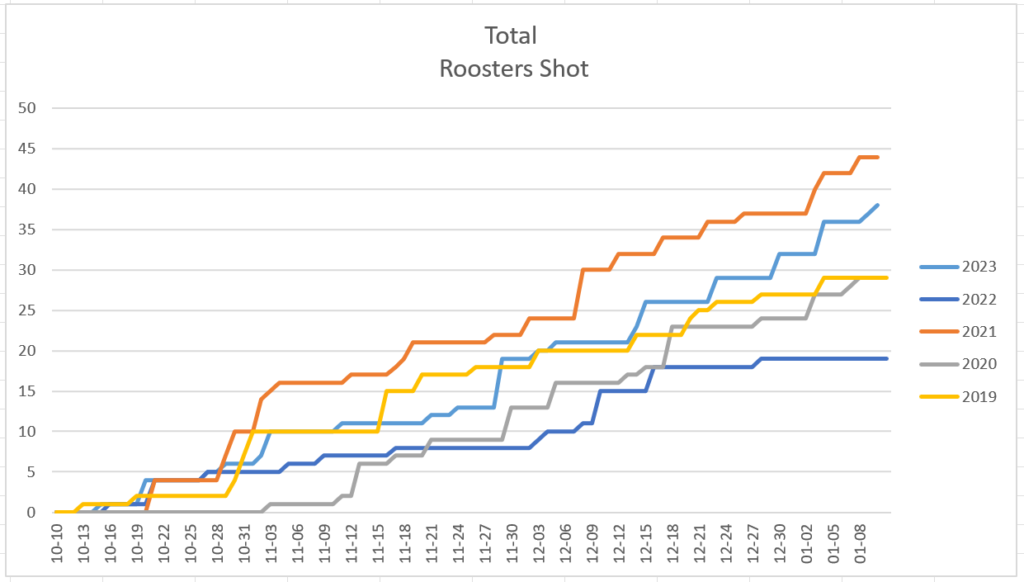
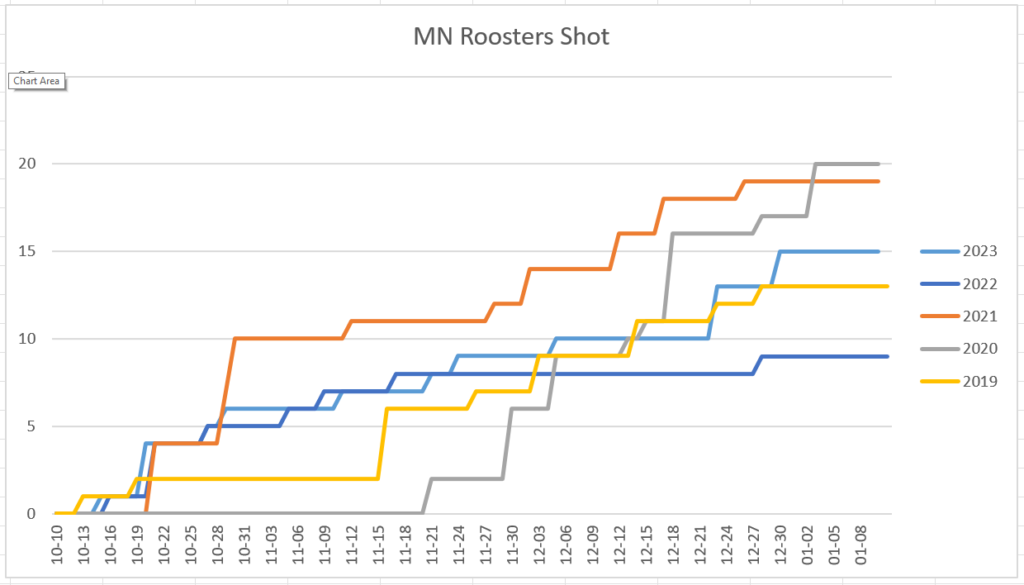
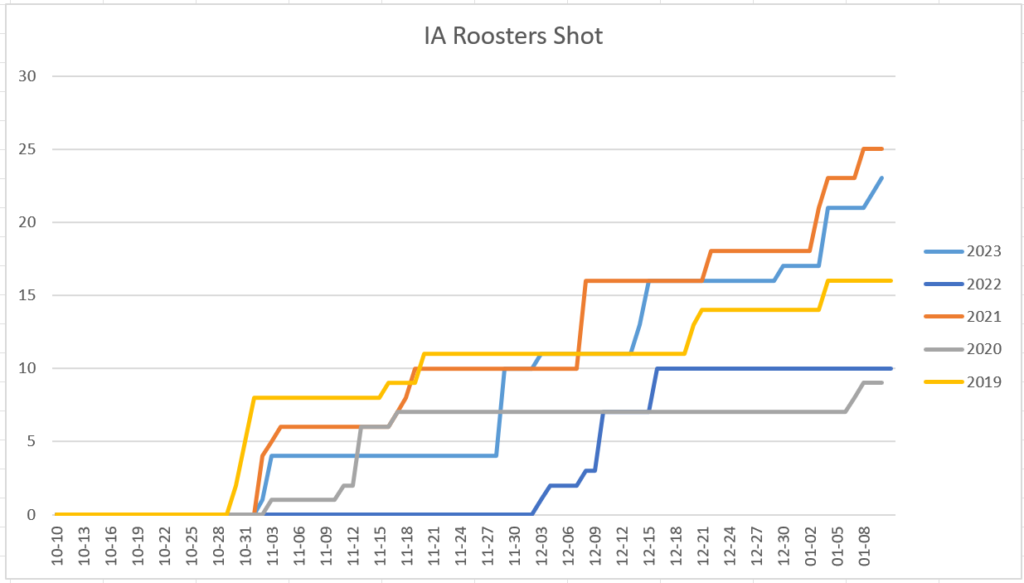
The following graphs show how many roosters we shot. As the previous graphs showed we saw more birds this year than ever before but we shot significantly less than 2021. That can be explained by having more guns per trip than the following years. More guns, mean more opportunities to get a shot.

Interesting recap. Those are some statistics!!