2022 Statistics Version 2 – This post contains updates to the 2022 pheasant hunting statistics previously published. The charts have been updated with data through 11/29/2022 plus added 2019 values for many of the charts.
Trip Counts and Miles Walked
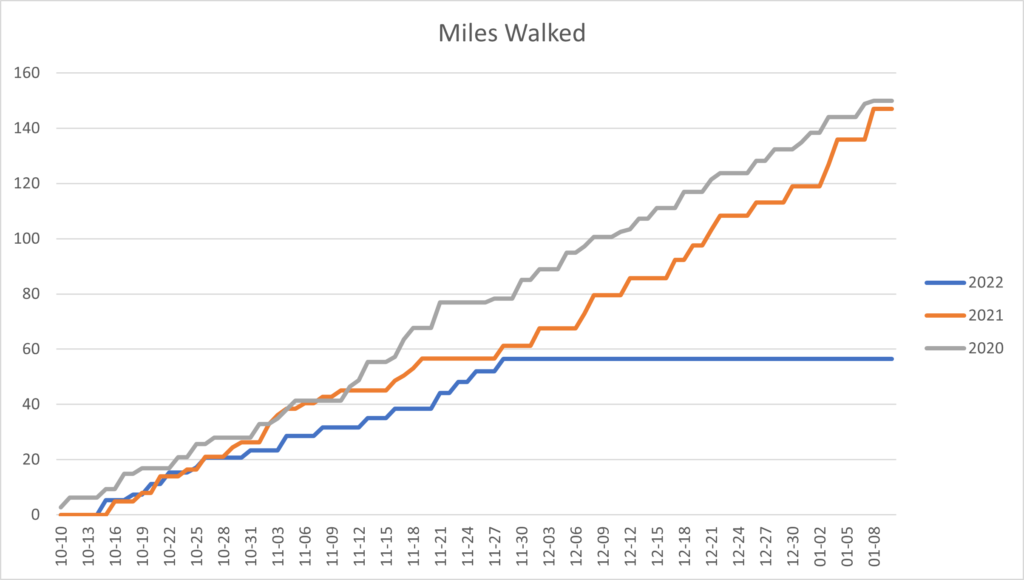
The first chart is of “Miles Walked”. The data is based just on my miles and does not include anyone else that I hunted with. I get the mileage data for myself and the dogs from the GPS collar system.
2020 was the COVID year which meant that while we often had multiple hunters in Minnesota, all of my Iowa trips were solo. In 2021 we were all healthy and hunted a lot. In 2022, as a group we have been plagued by injuries.
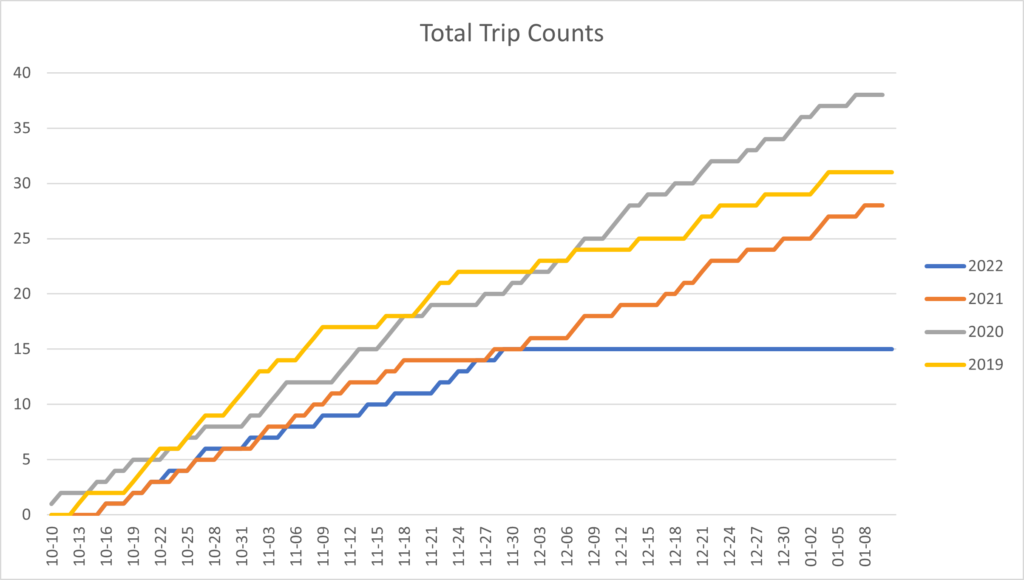
The next chart shows the year over year comparison of trips. Again, 2020 was the COVID year, I was healthy , newly retired and hunted a lot. In 2022, I had some nagging injuries that slowed me down plus it was hot during the early season. As of this date, we have not been to Iowa at all which is very unusual. We had trips planned but canceled them due to excessive heat.
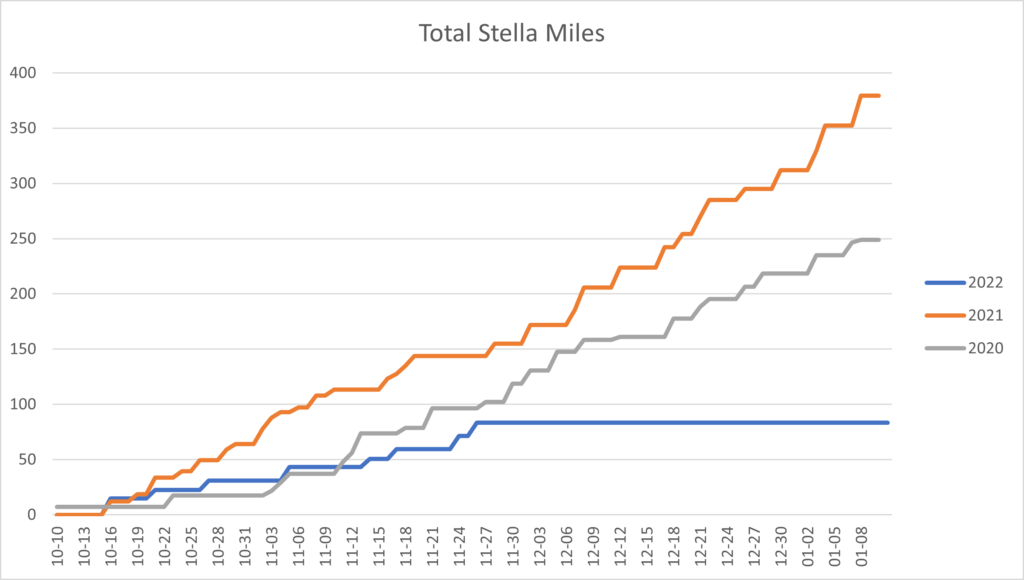
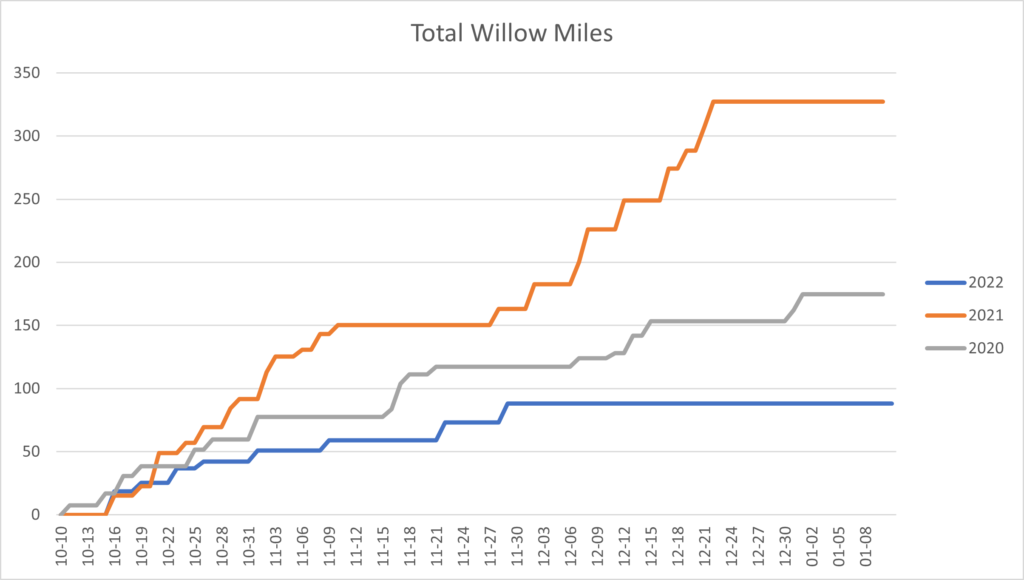
Dog Miles
Obviously the miles covered by the dogs is correlated to our trips and the weather. It has been too hot for the dogs, so even if we go, I have been keeping the trips shorter to avoid stressing the dogs. 2021 was much cooler. We even had snow in October.
Bird Counts
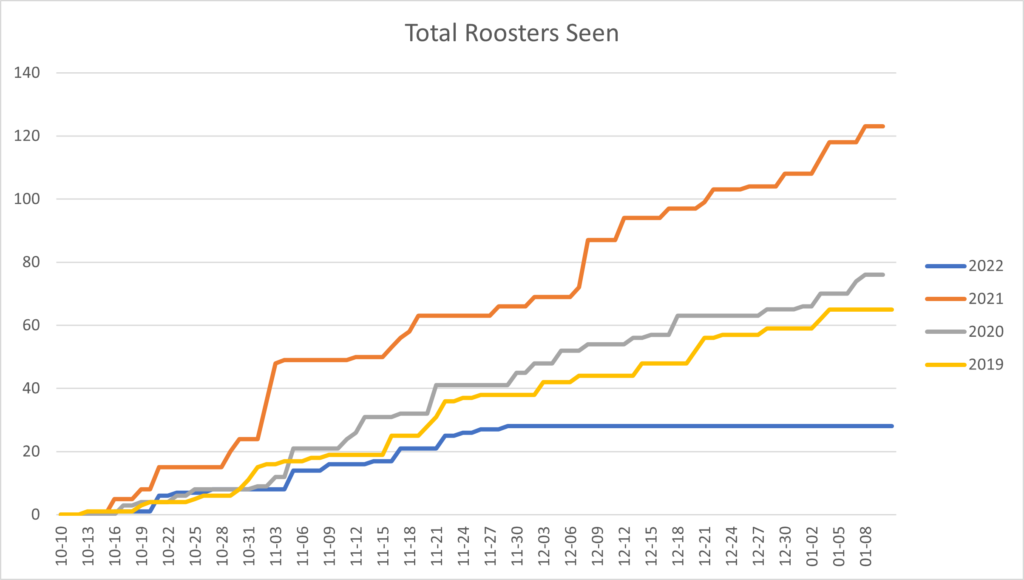
I track the number of roosters seen and shot by state. The following chart shows the total number of roosters seen. In 2021, we had more eyes on our hunts and the weather was better. Both 2020 and 2021 included Iowa trips where we generally see more birds.
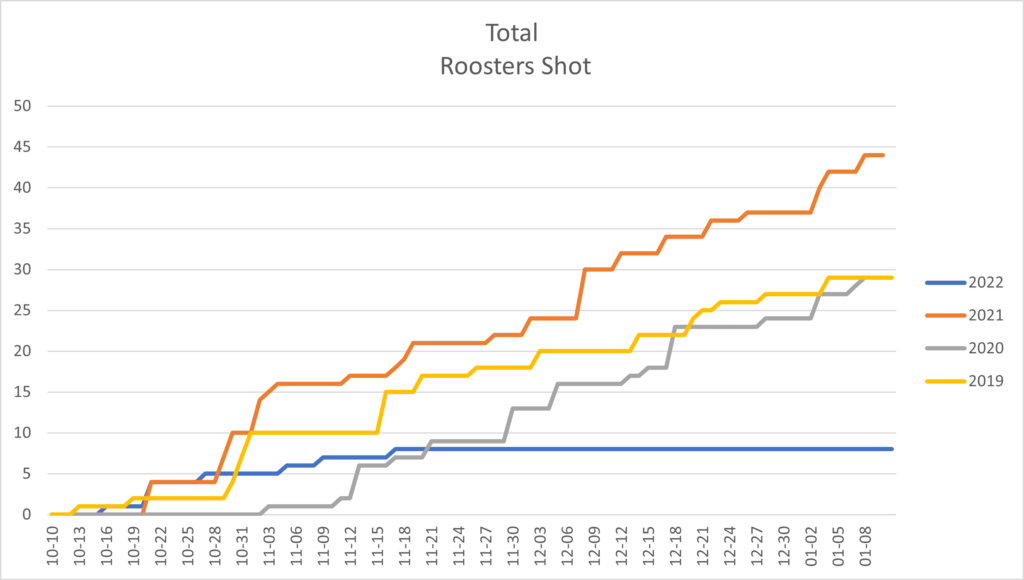
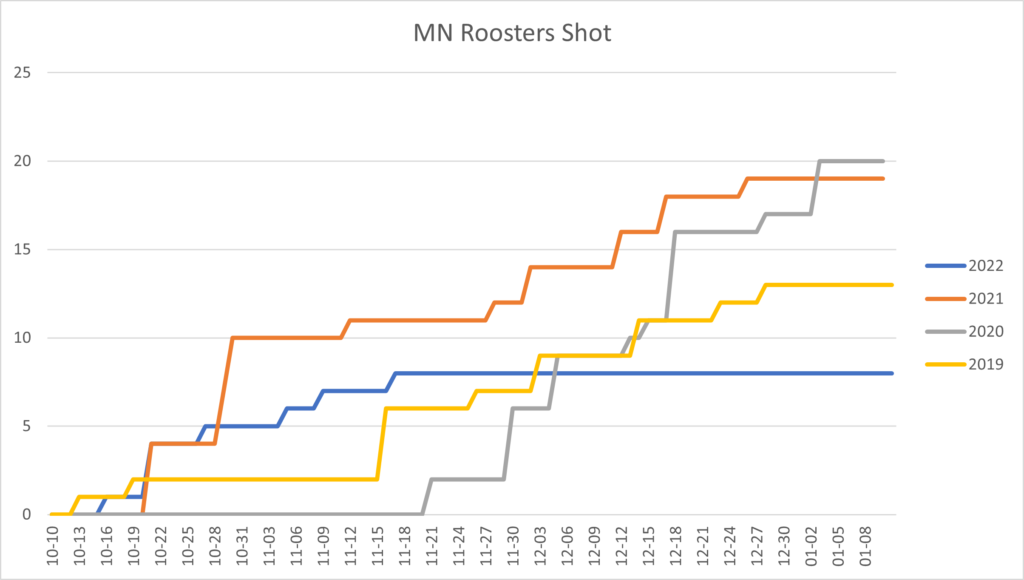
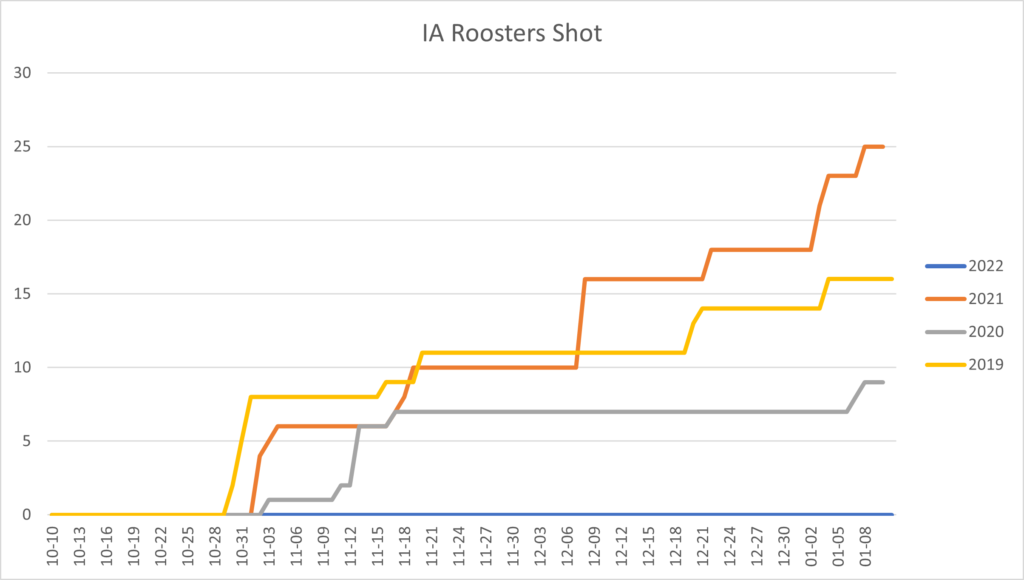
The following chart shows a comparison of the number of roosters shot. 2020 was the COVID year and I hunted solo most of the season. 2021 we were healthy and had a lot of trips with 2, 3 and sometimes 4 hunters. In 2022, with injuries the party sizes have been solo or two people. Combined with not going to Iowa yet, our harvest count is dramatically lower.
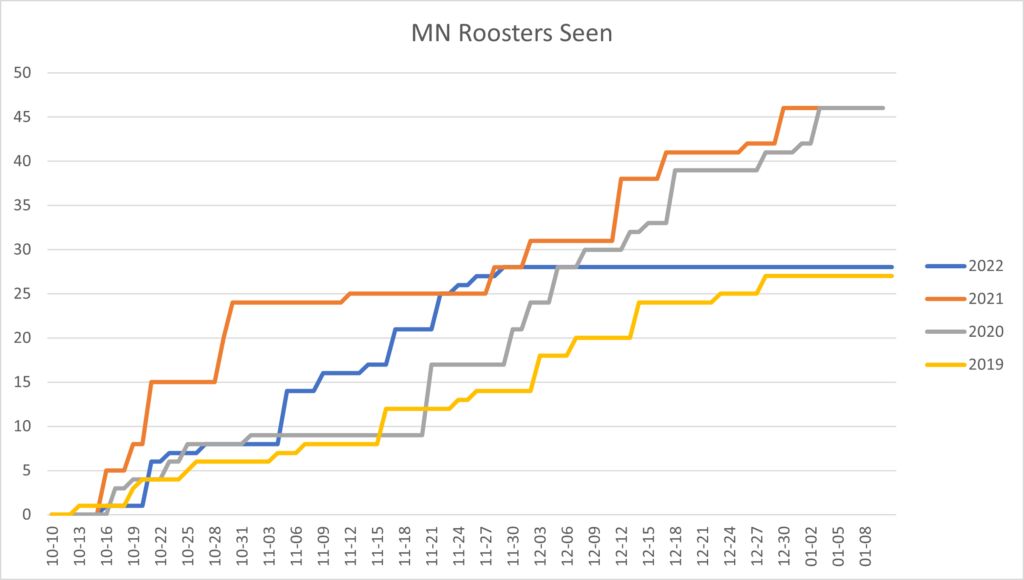
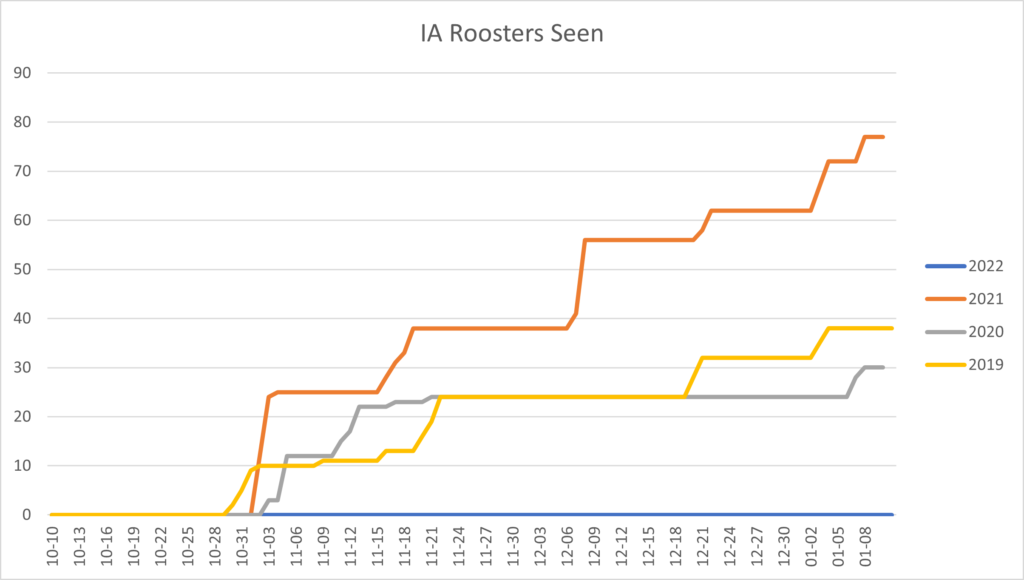
The following charts show a comparison of birds seen, broken down by state.
The next two charts show a comparison of birds shot, by state.
Summary
2022 Statistics Version 2 – Updated stats current through 11/29/2022. In general, all statistics are down for a variety of reasons:
- Drought has impacted the region. Cover is sparse, bird counts are okay.
- The weather has been hot, making it hard to get out.
- Injury. My hip is failing which is limiting the distances I can cover.